
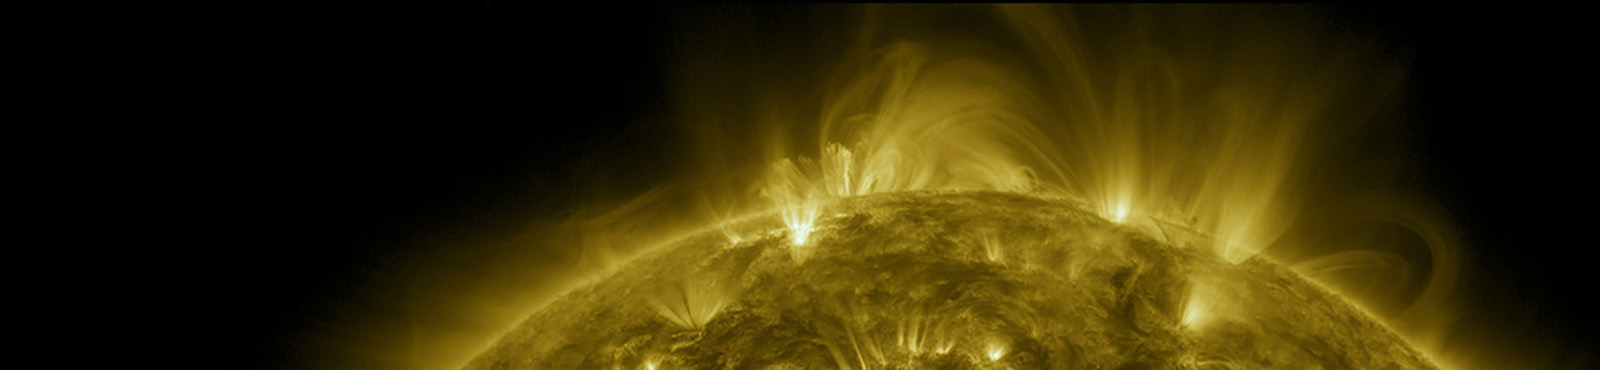
Solar reference spectrum is an absolute value of solar irradiance at a certain wavelength band. Solar reference spectrum, usually determined during the solar minimum or low solar activity periods, has important implications for climate science and sensor radiometric calibration. Approximately half of solar energy comes from wavelengths greater than 700 nm, and Earth’s reflectivity and absorbability are very different in the wavelengths shorter and greater than 700 nm. An accurate solar reference spectrum helps to reduce the uncertainties in determining Earth radiation balance. Because the solar spectrum is often used for sensor radiometric calibration, its accuracy also plays a vital role in the Global Space-based Inter-Calibration System (GSICS) as part of international efforts for climate monitoring, weather forecasting, and environmental applications.
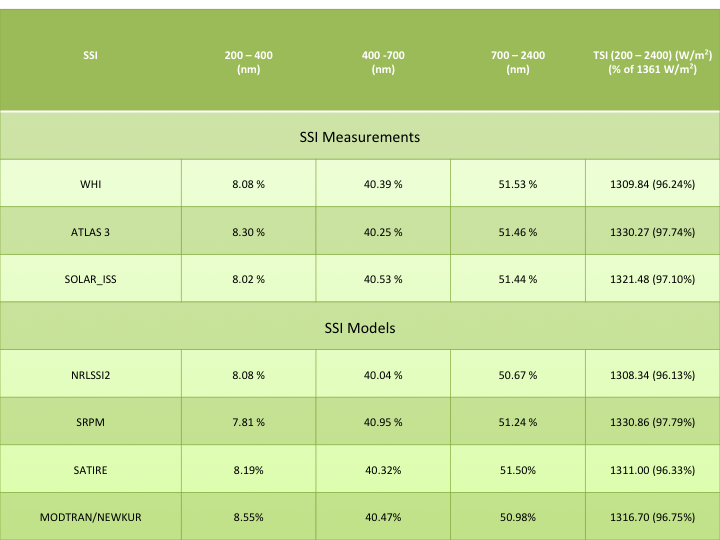
Table 1. Contribution of spectral solar irradiance (SSI) in different spectral bands between 200 and 2400 nm. Estimated % of the spectral solar irradiance is calculated with TSI integrated within 200-2400 nm. The % of TSI between 200 – 2400 nm to the 1361 W/m2 is also shown in the parenthesis.
Data Source
WHI
http://lasp.colorado.edu/lisird/data/whi_ref_spectra
Woods, T. N., P. C. Chamberlin, J. W. Harder, R. Hock, M. Snow, F. G. Eparvier, J. Fontenla, W. E. McClintock, and E. C. Richard (2009), Solar Irradiance Reference Spectra (SIRS) for the 2008 Whole Hemisphere Interval (WHI), Geophys. Res. Lett., 36, L01101.
ATLAS 3
https://sbuv2.gsfc.nasa.gov/solar/
Thuillier, G. L. Floyd, T. N. Woods, R. Cebula, E. Hilsenrath, M. Hersel, and D. Labs (2004), Solar Irradiance Reference Spectra, AGU Monograph 141, p. 171-193
SOLAR_ISS
Meftah M., Dame L., Bolsee D., Hauchecorne A., Pereira N., Sluse D., Cessateur G., Irbah A., Bureau J., Weber M., Bramstedt K., Hilbig T., Thieblemont R., Marchand M., Lefevre F., Sarkissian A., Bekki S. (2018), SOLAR-ISS, a new reference spectrum based on SOLAR/SOLSPEC observations, Astron.&Astrophys. 611, A1.
NRLSSI2
SRPM
Fontenla, J. M., J. Harder, W. Livingston, M. Snow, and T. Woods (2011), High‐resolution solar spectral irradiance from extreme ultraviolet to far infrared, J. Geophys. Res., 116, D20108, doi:10.1029/2011JD016032.
SATIRE-S
http://www2.mps.mpg.de/projects/sun-climate/data.html
Yeo K. L., Krivova N. A., Solanki S. K. and Glassmeier K. H. (2014), Reconstruction of total and spectral solar irradiance from 1974 to 2013 based on KPVT, SoHO/MDI, and SDO/HMI observations, Astron.&Astrophy.570A85.
MODTRAN
https://www.nrel.gov/grid/solar-resource/spectra.html
Kurucz, R.L., (1995), The solar irradiance by computation, Proc 17th Annual Conference Transmission
Models, Phillips Laboratory, Hanscom AFB, PL-TR-95-2060. G.P. Anderson, et al. Eds. PP 333-334.
Kurucz, R.L., et al. (1984), Solar Flux atlas from 296 to 1300 nm, National Solar Observatory Atlas No. 1.
NOAO, Sunspot, NM.
Comparison of Reference Spectra
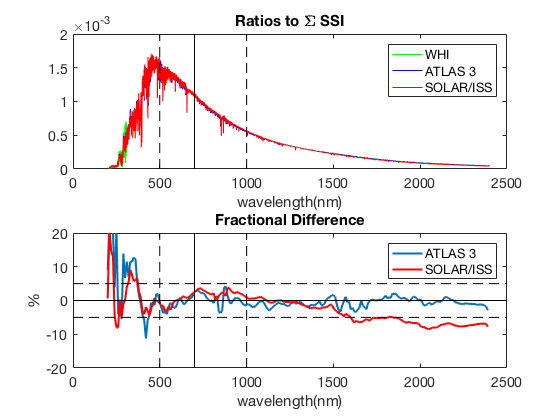
Figure 1. Comparison of WHI, ATLAS 3, and SOLAR_ISS solar reference spectra obtained from observations. Solid vertical line indicates 700 nm of wavelength, where approximately half of the total solar irradiance is distributed below and above this wavelength. Dotted vertical lines indicate 500 nm and 1000 nm of wavelength, where approximately 25% and 75% of the total solar irradiance is distributed, respectively. For each spectrum, ratio to ΣSSI is calculated as a ratio of absolute SSI respect to the sum of SSI within 200 to 2400 nm. Fractional difference is calculated as the ratio of the difference of each spectrum (I(λ) - I0((λ))/I0(λ), to WHI (I0).
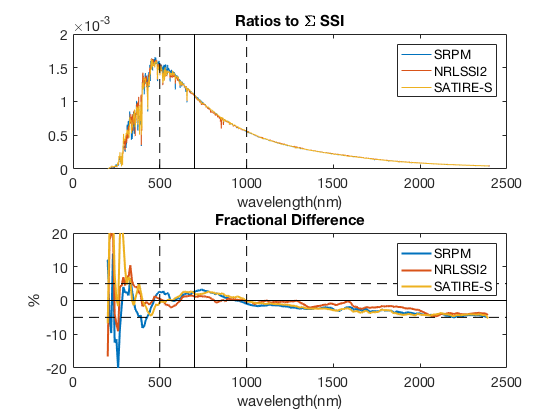
Figure 2. Same with Figure 1, but for the comparison of SRPM, NRLSSI2, and SATIRE-S, ATLAS 3, solar reference spectra obtained from models.
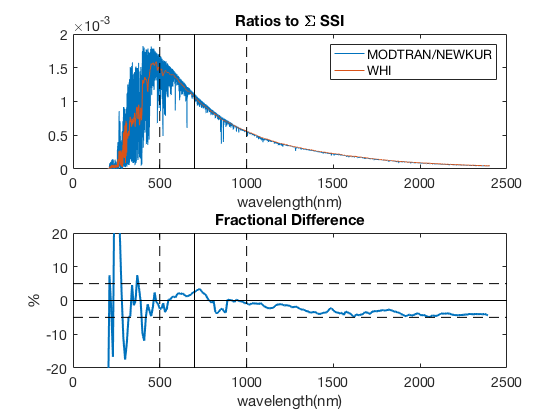
Figure 3. Same with Figure 1, but for the comparison of MODTRAN/NEWKUR solar reference spectrum.